Matplotlibで複数の画像を表示する
複数の画像データを見栄えよくならべて表示する方法を紹介します。
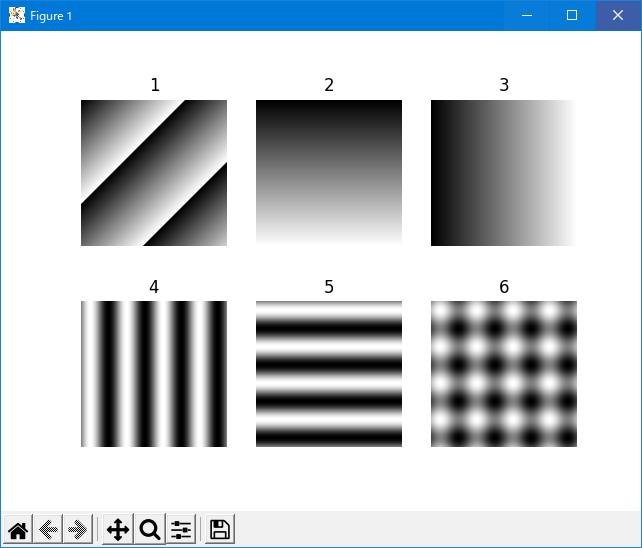
6個のデータを用意して、3列と2行にタイリングの表示にチャレンジします。
単純に連続して plt.show をコールする
まずは単純に6個の画像を出力してみます。
import numpy as np
import matplotlib.pyplot as plt
import math
w = 360
h = 360
numpix = w * h
# ubyte な1次元配列を確保する.
data0 = np.zeros( numpix, dtype=np.uint8)
data1 = np.zeros( numpix, dtype=np.uint8)
data2 = np.zeros( numpix, dtype=np.uint8)
data3 = np.zeros( numpix, dtype=np.uint8)
data4 = np.zeros( numpix, dtype=np.uint8)
data5 = np.zeros( numpix, dtype=np.uint8)
# サインデータ用の変数.
phase = 4.0
pai = math.pi
#---------------------------------------------
# ななめウロコデータを格納する.
for j in range( h ):
adrs = w * j
for i in range( w ):
level = i + j
data0[ adrs ] = level
adrs += 1
#---------------------------------------------
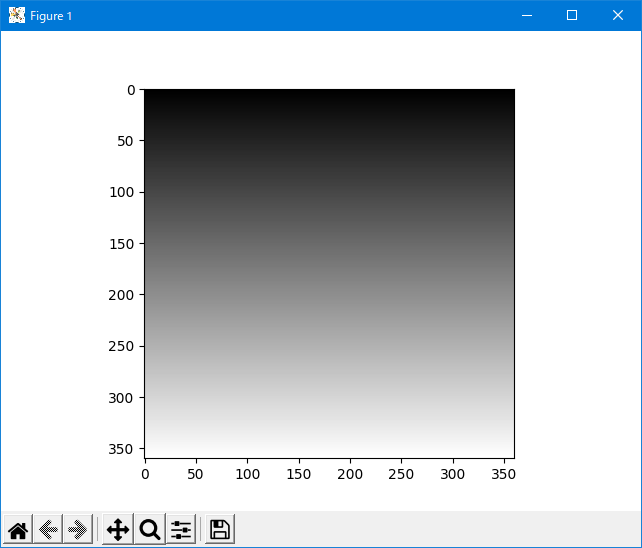
# 水平グラデーション.
for j in range( h ):
adrs = w * j
rate = j /( h - 1 )
level = rate * 255
for i in range( w ):
data1[ adrs ] = level
adrs += 1
#---------------------------------------------
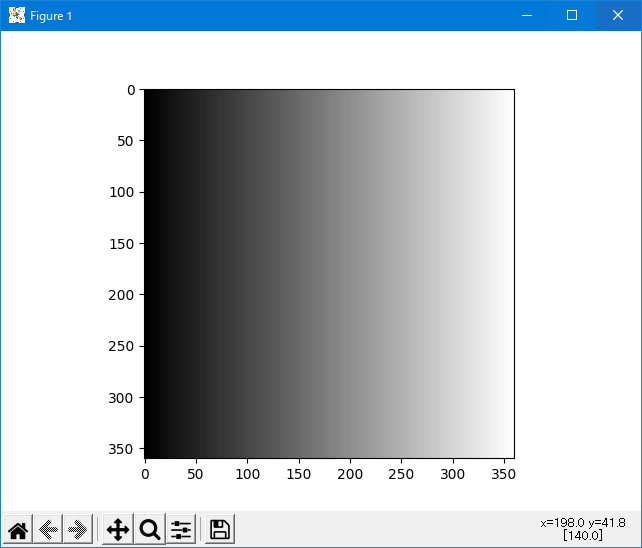
# 垂直グラデーション.
for j in range( h ):
adrs = w * j
for i in range( w ):
rate = i /( w - 1 )
level = rate * 255
data2[ adrs ] = level
adrs += 1
#---------------------------------------------
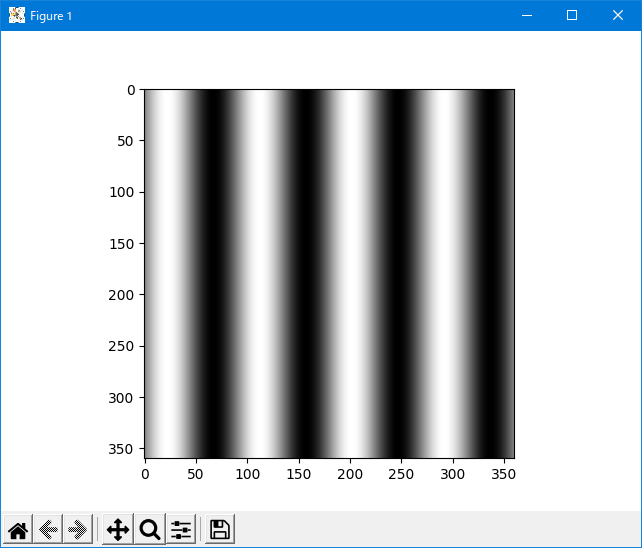
# 垂直サイン.
for j in range( h ):
adrs = w * j
for i in range( w ):
rate_x = i /( w - 1 )
deg = rate_x * 360.0
rad = ( deg / 180.0 ) * pai
level = math.sin( phase * rad )
level += 1.0
level *= 0.5
level *= 255.0
data3[ adrs ] = level
adrs += 1
#---------------------------------------------
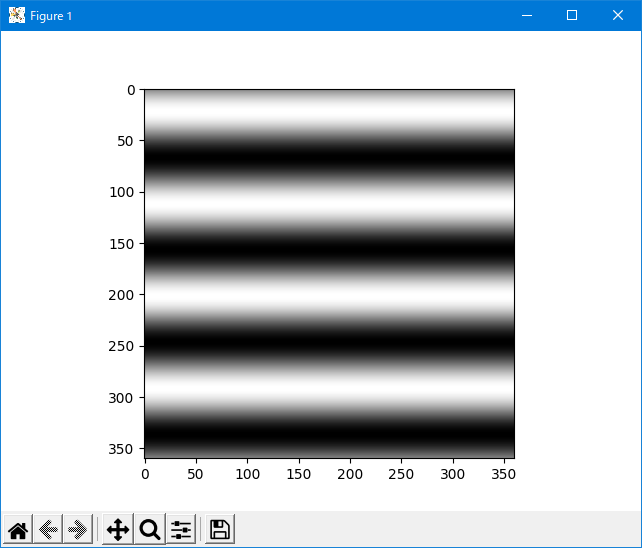
# 水平サイン.
for j in range( h ):
adrs = w * j
rate_y = j /( h - 1 )
deg = rate_y * 360.0
rad = ( deg / 180.0 ) * pai
level = math.sin( phase * rad )
level += 1.0
level *= 0.5
level *= 255.0
for i in range( w ):
data4[ adrs ] = level
adrs += 1
#---------------------------------------------
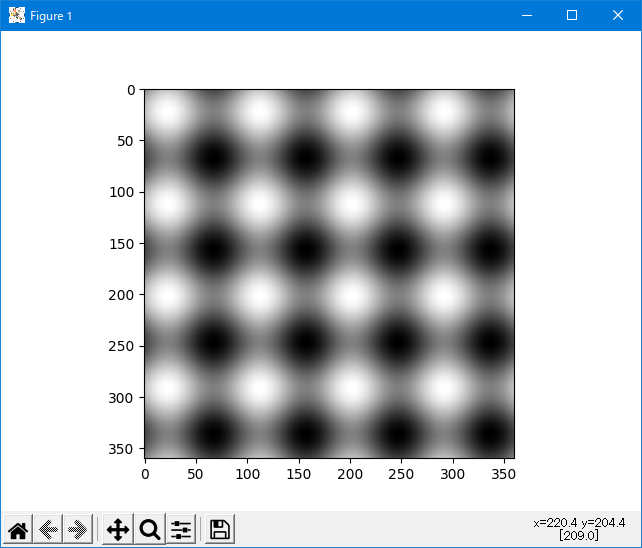
# ななめグラデーション.
for j in range( h ):
adrs = w * j
rate_y = j /( h - 1 )
deg = rate_y * 360.0
rad = ( deg / 180.0 ) * pai
level_y = math.sin( phase * rad )
level_y += 1.0
level_y *= 0.5
level_y *= 127.0
for i in range( w ):
rate_x = i /( w - 1 )
rate_x = i /( w - 1 )
deg = rate_x * 360.0
rad = ( deg / 180.0 ) * pai
level_x = math.sin( phase * rad )
level_x += 1.0
level_x *= 0.5
level_x *= 128.0
data5[ adrs ] = level_x + level_y
adrs += 1
#---------------------------------------------
# 2次元配列に変換する、w と h の順に注目せよ.
data0_2d = data0.reshape( h, w )
data1_2d = data1.reshape( h, w )
data2_2d = data2.reshape( h, w )
data3_2d = data3.reshape( h, w )
data4_2d = data4.reshape( h, w )
data5_2d = data5.reshape( h, w )
# Matplotlib で画像を表示する.
plt.imshow( data0_2d, cmap='gray')
plt.show()
# Matplotlib で画像を表示する.
plt.imshow( data1_2d, cmap='gray')
plt.show()
# Matplotlib で画像を表示する.
plt.imshow( data2_2d, cmap='gray')
plt.show()
# Matplotlib で画像を表示する.
plt.imshow( data3_2d, cmap='gray')
plt.show()
# Matplotlib で画像を表示する.
plt.imshow( data4_2d, cmap='gray')
plt.show()
# Matplotlib で画像を表示する.
plt.imshow( data5_2d, cmap='gray')
plt.show()
print( "finish." )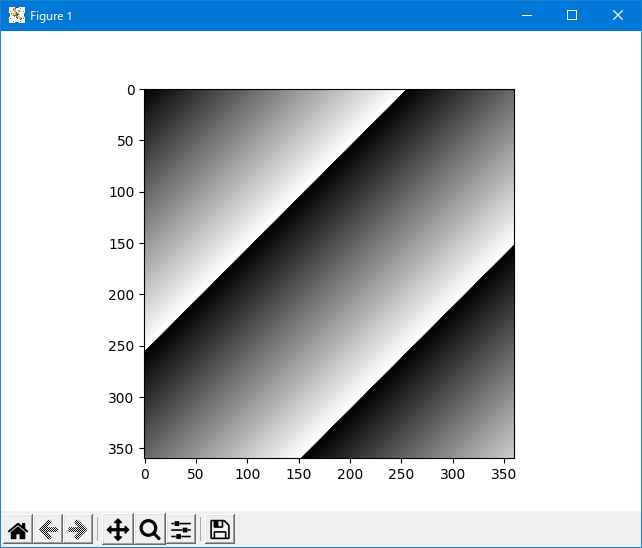
subplot を使ってタイリング画像表示する(ベタ書き版)
subplot という命令を使って、画像をオフスクリーンでタイリング書き込みしておいて、最後に plt.show 命令でイッキに表示します。
import numpy as np
import matplotlib.pyplot as plt
import math

w = 360
h = 360
numpix = w * h

# ubyte な1次元配列を確保する.
data0 = np.zeros( numpix, dtype=np.uint8)
data1 = np.zeros( numpix, dtype=np.uint8)
data2 = np.zeros( numpix, dtype=np.uint8)
data3 = np.zeros( numpix, dtype=np.uint8)
data4 = np.zeros( numpix, dtype=np.uint8)
data5 = np.zeros( numpix, dtype=np.uint8)

# サインデータ用の変数.
phase = 4.0
pai = math.pi

#---------------------------------------------
# ななめウロコデータを格納する.
for j in range( h ):
    adrs = w * j
    for i in range( w ):
        level = i + j
        data0[ adrs ] = level
        adrs += 1
#---------------------------------------------
# 水平グラデーション.
for j in range( h ):
    adrs = w * j
    rate = j /( h - 1 )
    level = rate * 255
    for i in range( w ):
        data1[ adrs ] = level
        adrs += 1
#---------------------------------------------
# 垂直グラデーション.
for j in range( h ):
    adrs = w * j
    for i in range( w ):
        rate = i /( w - 1 )
        level = rate * 255
        data2[ adrs ] = level
        adrs += 1
#---------------------------------------------
# 垂直サイン.
for j in range( h ):
    adrs = w * j
    for i in range( w ):
        rate_x = i /( w - 1 )
        deg = rate_x * 360.0
        rad = ( deg / 180.0 ) * pai
        level = math.sin( phase * rad )
        level += 1.0
        level *= 0.5
        level *= 255.0
        data3[ adrs ] = level
        adrs += 1
#---------------------------------------------
# 水平サイン.
for j in range( h ):
    adrs = w * j
    rate_y = j /( h - 1 )
    deg = rate_y * 360.0
    rad = ( deg / 180.0 ) * pai
    level = math.sin( phase * rad )
    level += 1.0
    level *= 0.5
    level *= 255.0
    for i in range( w ):
        data4[ adrs ] = level
        adrs += 1
#---------------------------------------------
# ななめグラデーション.
for j in range( h ):
    adrs = w * j
    rate_y = j /( h - 1 )
    deg = rate_y * 360.0
    rad = ( deg / 180.0 ) * pai
    level_y = math.sin( phase * rad )
    level_y += 1.0
    level_y *= 0.5
    level_y *= 127.0
    for i in range( w ):
        rate_x = i /( w - 1 )
        rate_x = i /( w - 1 )
        deg = rate_x * 360.0
        rad = ( deg / 180.0 ) * pai
        level_x = math.sin( phase * rad )
        level_x += 1.0
        level_x *= 0.5
        level_x *= 128.0
        data5[ adrs ] = level_x + level_y
        adrs += 1
#---------------------------------------------


# 2次元配列に変換する、w と h の順に注目せよ.
data0_2d = data0.reshape( h, w )
data1_2d = data1.reshape( h, w )
data2_2d = data2.reshape( h, w )
data3_2d = data3.reshape( h, w )
data4_2d = data4.reshape( h, w )
data5_2d = data5.reshape( h, w )

# 書き込み要素を取得する.
fig = plt.figure()

# タイルの縦横の個数.
TILE_NUM_ROW = 2
TILE_NUM_COL = 3

# プロットの位置を示すカウンタ(1スタートなのが気持ち悪い).
plot_counter = 1

ax = fig.add_subplot( TILE_NUM_ROW, TILE_NUM_COL, plot_counter )
ax.set_title( "{0}".format( plot_counter ))
ax.axis( "off" )
plt.imshow( data0_2d, cmap="gray" )
plot_counter += 1

ax = fig.add_subplot( TILE_NUM_ROW, TILE_NUM_COL, plot_counter )
ax.set_title( "{0}".format( plot_counter ))
ax.axis( "off" )
plt.imshow( data1_2d, cmap="gray" )
plot_counter += 1

ax = fig.add_subplot( TILE_NUM_ROW, TILE_NUM_COL, plot_counter )
ax.set_title( "{0}".format( plot_counter ))
ax.axis( "off" )
plt.imshow( data2_2d, cmap="gray" )
plot_counter += 1

ax = fig.add_subplot( TILE_NUM_ROW, TILE_NUM_COL, plot_counter )
ax.set_title( "{0}".format( plot_counter ))
ax.axis( "off" )
plt.imshow( data3_2d, cmap="gray" )
plot_counter += 1

ax = fig.add_subplot( TILE_NUM_ROW, TILE_NUM_COL, plot_counter )
ax.set_title( "{0}".format( plot_counter ))
ax.axis( "off" )
plt.imshow( data4_2d, cmap="gray" )
plot_counter += 1

ax = fig.add_subplot( TILE_NUM_ROW, TILE_NUM_COL, plot_counter )
ax.set_title( "{0}".format( plot_counter ))
ax.axis( "off" )
plt.imshow( data5_2d, cmap="gray" )
plot_counter += 1

plt.show()

print( "finish." )
subplot を使ってタイリング画像表示する(forループ)
さすがに上記のコードは効率が悪いので for ループに書き換えるとこうなります。
import numpy as np
import matplotlib.pyplot as plt
import math

w = 360
h = 360
numpix = w * h

# ubyte な1次元配列を確保する.
data0 = np.zeros( numpix, dtype=np.uint8)
data1 = np.zeros( numpix, dtype=np.uint8)
data2 = np.zeros( numpix, dtype=np.uint8)
data3 = np.zeros( numpix, dtype=np.uint8)
data4 = np.zeros( numpix, dtype=np.uint8)
data5 = np.zeros( numpix, dtype=np.uint8)

# サインデータ用の変数.
phase = 4.0
pai = math.pi

#---------------------------------------------
# ななめウロコデータを格納する.
for j in range( h ):
    adrs = w * j
    for i in range( w ):
        level = i + j
        data0[ adrs ] = level
        adrs += 1
#---------------------------------------------
# 水平グラデーション.
for j in range( h ):
    adrs = w * j
    rate = j /( h - 1 )
    level = rate * 255
    for i in range( w ):
        data1[ adrs ] = level
        adrs += 1
#---------------------------------------------
# 垂直グラデーション.
for j in range( h ):
    adrs = w * j
    for i in range( w ):
        rate = i /( w - 1 )
        level = rate * 255
        data2[ adrs ] = level
        adrs += 1
#---------------------------------------------
# 垂直サイン.
for j in range( h ):
    adrs = w * j
    for i in range( w ):
        rate_x = i /( w - 1 )
        deg = rate_x * 360.0
        rad = ( deg / 180.0 ) * pai
        level = math.sin( phase * rad )
        level += 1.0
        level *= 0.5
        level *= 255.0
        data3[ adrs ] = level
        adrs += 1
#---------------------------------------------
# 水平サイン.
for j in range( h ):
    adrs = w * j
    rate_y = j /( h - 1 )
    deg = rate_y * 360.0
    rad = ( deg / 180.0 ) * pai
    level = math.sin( phase * rad )
    level += 1.0
    level *= 0.5
    level *= 255.0
    for i in range( w ):
        data4[ adrs ] = level
        adrs += 1
#---------------------------------------------
# ななめグラデーション.
for j in range( h ):
    adrs = w * j
    rate_y = j /( h - 1 )
    deg = rate_y * 360.0
    rad = ( deg / 180.0 ) * pai
    level_y = math.sin( phase * rad )
    level_y += 1.0
    level_y *= 0.5
    level_y *= 127.0
    for i in range( w ):
        rate_x = i /( w - 1 )
        rate_x = i /( w - 1 )
        deg = rate_x * 360.0
        rad = ( deg / 180.0 ) * pai
        level_x = math.sin( phase * rad )
        level_x += 1.0
        level_x *= 0.5
        level_x *= 128.0
        data5[ adrs ] = level_x + level_y
        adrs += 1
#---------------------------------------------


# 2次元配列に変換する、w と h の順に注目せよ.
data0_2d = data0.reshape( h, w )
data1_2d = data1.reshape( h, w )
data2_2d = data2.reshape( h, w )
data3_2d = data3.reshape( h, w )
data4_2d = data4.reshape( h, w )
data5_2d = data5.reshape( h, w )

# 書き込み要素を取得する.
fig = plt.figure()

# タイルの縦横の個数.
TILE_NUM_ROW = 2
TILE_NUM_COL = 3

# データを管理するリストを作成する.
list_data = []
list_data.append( data0_2d )
list_data.append( data1_2d )
list_data.append( data2_2d )
list_data.append( data3_2d )
list_data.append( data4_2d )
list_data.append( data5_2d )

# プロットの位置を示すカウンタ(1スタートなのが気持ち悪い).
plot_counter = 1

# リストの要素回数だけループする.
for data in list_data:
    ax = fig.add_subplot( TILE_NUM_ROW, TILE_NUM_COL, plot_counter )
    ax.set_title( "{0}".format( plot_counter ))
    ax.axis( "off" )
    plt.imshow( data, cmap="gray" )
    plot_counter += 1

plt.show()

print( "finish." )
ちなみに Python には foreach 文は存在しませんが、for 文がやたらと拡張定義されているので foreach のように記述することができます。
最後の for ループは下記のような書き方もできます。C言語などに慣れている人はこっちのほうがしっくりくるかもしれません。
# リストの要素回数だけループする.
for n in range( len( list_data )):
    plot_num = n + 1
    ax = fig.add_subplot( TILE_NUM_ROW, TILE_NUM_COL, plot_num )
    ax.set_title( "{0}".format( plot_num ))
    ax.axis( "off" )
    plt.imshow( list_data[n], cmap="gray" )

plt.show()

print( "finish." )
先に示したプロット結果と同じですが、いちおう実行結果を示しておきます。