numpy配列を扱う
配列を扱うのは numpy を使うのが簡単です。使い始めは簡単ですが、やれることが多すぎてびっくりしてしまいます。複雑なことをやるにはそれなりに難しいので、十分にテストしてから実戦に投入してください。
import numpy as np
import math
import matplotlib.pyplot as plt
# 配列の要素数.
NUM = 16
#----------------------------------------
# ゼロ初期化.
a = np.zeros( NUM )
print( "zeros" )
print( a )
#----------------------------------------
# イチ初期化.
b = np.ones( NUM )
print( "ones" )
print( b )
#----------------------------------------
# 任意値で初期化,
value = math.pi # 円周率.
c = np.full( NUM, value )
print( "full" )
print( c )
#----------------------------------------
# 配列を数列で初期化する.
u = np.arange( NUM )
# これも同じ結果になる.
# u = np.arange( 0, NUM )
print( "1次元配列" )
print( u )
#----------------------------------------
num_row = 2
num_col = 8
print( "{0}行{1}列".format( num_row, num_col ) )
if ( num_row * num_col ) == NUM :
# 配列を2次元に変形する.
u28 = u.reshape( num_row, num_col )
print( u28 )
else:
print( "error u28." )
#----------------------------------------
num_row = 8
num_col = 2
print( "{0}行{1}列".format( num_row, num_col ) )
if ( num_row * num_col ) == NUM :
# 配列を2次元に変形する.
u82 = u.reshape( num_row, num_col )
print( u82 )
else:
print( "error u82." )
#----------------------------------------
# 配列の型変換を実施する.
print( "arr" )
arr = u
print( arr )
print( arr.dtype )
# float32 に変換する.
print( "arr_f32" )
arr_f32 = arr.astype( np.float32 )
print( arr_f32 )
print( arr_f32.dtype )
# float32 から int32 に戻す.
print( "arr_i32" )
arr_i32 = arr_f32.astype( np.int32 )
print( arr_i32 )
print( arr_i32.dtype )
#----------------------------------------
# データに乱数を仕込む.
data = np.random.rand( NUM )
for n in range( len( data )):
print( "[{0}]\t{1}".format( n, data[n] ) )
# 最小値と最大値を取得する.
value_min = np.min( data )
value_max = np.max( data )
print( "min is {0}".format( value_min ))
print( "max is {0}".format( value_max ))
# 最小値と最大値が格納されている要素のインデックスを取得する.
index_value_min = np.argmin( data )
index_value_max = np.argmax( data )
print( "min index is {0}".format( index_value_min ))
print( "max index is {0}".format( index_value_max ))
#----------------------------------------
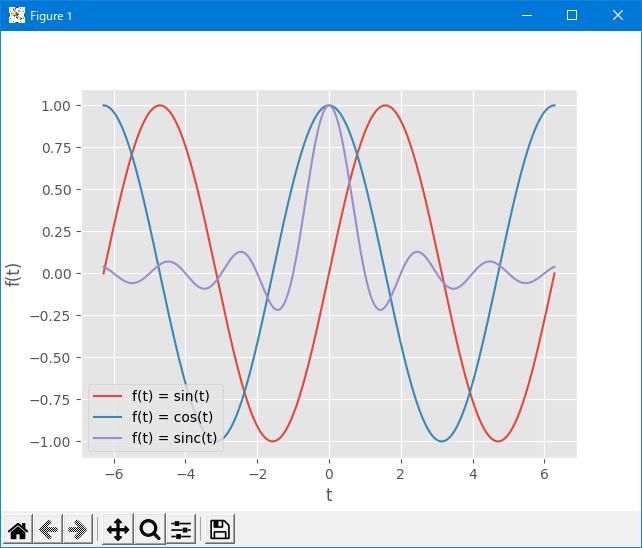
# 三角関数データを仕込む.
NUM_DATA = 4096
value_start = -( 2.0 * math.pi )
value_stop = +( 2.0 * math.pi )
# endpoint が True の場合は value_stop を含む、False は含まない.
t = np.linspace( value_start, value_stop, num = NUM_DATA, endpoint = True )
# 三角関数データを取得する.
ft0 = np.sin( t )
ft1 = np.cos( t )
ft2 = np.sinc( t )
ft3 = np.tan( t )
# フィギュアを取得する.
fig = plt.figure()
# プロットのスタイルを設定する.
plt.style.use( "ggplot" )
# グラフ描画領域を追加する.
ax = fig.add_subplot( 1, 1, 1 )
# x軸, y軸のラベルを設定する.
ax.set_xlabel( "t" )
ax.set_ylabel( "f(t)" )
# 三角関数のデータをグラフにプロットする.
ax.plot( t, ft0, label = "f(t) = sin(t)")
ax.plot( t, ft1, label = "f(t) = cos(t)")
ax.plot( t, ft2, label = "f(t) = sinc(t)")
# tan をいれると最大最小が無限小と無限大になるので sin と cos と sinc が視認できない.
#ax.plot( t, ft3, label = "f(t) = tan(t)")
# 凡例は左下に表示する.
ax.legend( loc = "lower left" )
# 全部準備ができたら表示する.
plt.show()下記が実行結果です。
zeros
[0. 0. 0. 0. 0. 0. 0. 0. 0. 0. 0. 0. 0. 0. 0. 0.]
ones
[1. 1. 1. 1. 1. 1. 1. 1. 1. 1. 1. 1. 1. 1. 1. 1.]
full
[3.14159265 3.14159265 3.14159265 3.14159265 3.14159265 3.14159265
 3.14159265 3.14159265 3.14159265 3.14159265 3.14159265 3.14159265
 3.14159265 3.14159265 3.14159265 3.14159265]
1次元配列
[ 0  1  2  3  4  5  6  7  8  9 10 11 12 13 14 15]
2行8列
[[ 0  1  2  3  4  5  6  7]
 [ 8  9 10 11 12 13 14 15]]
8行2列
[[ 0  1]
 [ 2  3]
 [ 4  5]
 [ 6  7]
 [ 8  9]
 [10 11]
 [12 13]
 [14 15]]
arr
[ 0  1  2  3  4  5  6  7  8  9 10 11 12 13 14 15]
int32
arr_f32
[ 0.  1.  2.  3.  4.  5.  6.  7.  8.  9. 10. 11. 12. 13. 14. 15.]
float32
arr_i32
[ 0  1  2  3  4  5  6  7  8  9 10 11 12 13 14 15]
int32
[0]     0.06401046525570153
[1]     0.06441649062791
[2]     0.8808807485973807
[3]     0.008994661508332613
[4]     0.2785420803014089
[5]     0.3429880577742197
[6]     0.1896763389916537
[7]     0.296343340333196
[8]     0.7696854864831936
[9]     0.3075024455451013
[10]    0.8020368865103176
[11]    0.5577516965347638
[12]    0.6687433509482585
[13]    0.28572773102521
[14]    0.8826518174322268
[15]    0.5515740048199201
min is 0.008994661508332613
max is 0.8826518174322268
min index is 3
max index is 14